
Annually, we survey general consumers about their perception of Google, asking the same four questions the same way so we can watch sentiment move rather than guess at it. In 2024, we noted that Google’s “best search results” score had hit a technical all-time low and wrote that if the trend continued once more, it would be time to start comparing Google to other search engines, especially the new market entrant from OpenAI.
The trend continued, so this year we finally made that comparison, measuring Google against a real AI alternative for the first time.
In July 2026, we surveyed 256 US consumers through a paid, third-party respondent panel (Survey Monkey). The first four questions below are our tracked annual questions, worded identically to every prior year. The rest are new for 2026, built around the most significant change in search behavior since we started this series: consumers now have a real alternative to Google, and a majority of them are using it.
However, given how significant AI’s rise has been over the past two years, we expected to see a much sharper drop-off in Google usage. The data surprised us: consumer platforms remain a mainstay, which is a good reminder to trust what people actually do rather than our assumptions about what they might be doing. It’s a lesson these surveys teach us again and again.
The Annual Numbers: Consumer Perception of Google, 2021 to 2026
As always, respondents answered on a scale of one to ten, with one being “least likely,” ten being “most likely,” and five indicating a neutral response. No edition of this survey ran in 2025, so the series moves from 2024 directly to 2026.
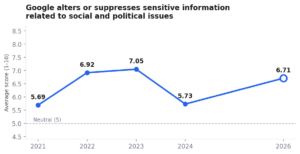
How likely is it that Google alters or suppresses sensitive information related to social and political issues?
2021: 5.69 | 2022: 6.92 | 2023: 7.05 | 2024: 5.73 | 2026: 6.71
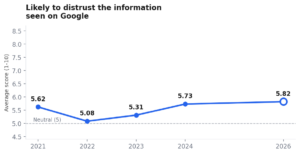
How likely are you to distrust the information you’re seeing on Google?
2021: 5.62 | 2022: 5.08 | 2023: 5.31 | 2024: 5.73 | 2026: 5.82
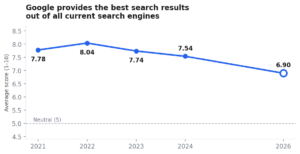
How likely is it that Google provides the best search results out of all current search engines?
2021: 7.78 | 2022: 8.04 | 2023: 7.74 | 2024: 7.54 | 2026: 6.90
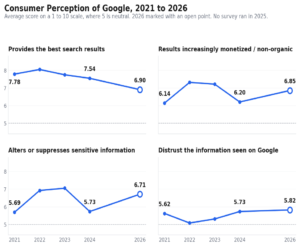
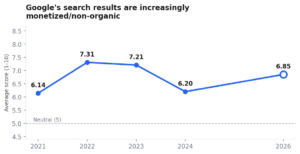
How likely is it that Google’s search results are increasingly monetized/non-organic?
2021: 6.14 | 2022: 7.31 | 2023: 7.21 | 2024: 6.20 | 2026: 6.85
Three findings stand out immediately.
First, the number we have been watching for five years finally broke. Google’s “best search results” score did not slide gradually this time. It fell from 7.54 to 6.90, the largest single drop in the history of this survey and a new all-time low by a wide margin. In 2021, consumers rated Google a 7.78. Five years later, that confidence has eroded by nearly a full point, with most of the damage occurring in the last two years. Consumers still lean positive on Google’s results, but “clearly the best” has become “probably the best,” and that distinction matters enormously when a viable alternative exists for the first time.
Second, the belief that Google alters or suppresses sensitive information jumped nearly a full point, from 5.73 back up to 6.71, approaching the 2023 peak. Whatever goodwill Google recovered in 2024 on this question, it gave back.
Third, monetization concern rebounded from 6.20 to 6.85. In 2024, we saw this number drop significantly and wondered if consumers had simply acclimated to ads, Local Service Ads, and sponsored placements. The 2026 data suggest they have not acclimated so much as they had a brief pause. Sponsored results today are also harder to spot than they once were, woven into the page more subtly rather than clearly marked, which may be masking just how much monetized inventory consumers are actually seeing. With AI Overviews now occupying the top of many results pages alongside this existing paid inventory, the perception that Google’s results serve Google first is back near its high-water mark.
The New Questions: Google Versus AI
Our 2024 edition ended with a hypothetical. This edition replaces it with data. We asked consumers directly about their use of AI assistants like ChatGPT, Gemini, and Perplexity as a substitute for Google.
71% of consumers used an AI assistant instead of Google to answer a question in the past month. Only 29% said “never.” Among the users, 21% did it once or twice, 22% a few times a week, and 18% daily. And 9% of all respondents told us that AI assistants are now their primary way of searching.
Sit with that last number. Nearly one in ten consumers have already replaced Google as their default. Not supplemented. Replaced. Two years ago, this choice would not have made sense to include. It tracks with what we found when we looked at how AI is reshaping consumer perceptions of search: the shift isn’t hypothetical anymore, it’s measurable.”
One important note on our sample: this year’s respondent poll skewed older, with respondents 55 and over making up roughly 39% of the sample and 65+ alone accounting for 32%. If anything, that makes these AI adoption numbers conservative. A younger-weighted sample would almost certainly push them higher.
When we asked how likely consumers are to trust an answer from an AI assistant compared to Google search results, the average was 5.58. That is above neutral. On its face, an emerging technology scoring within 1.3 points of Google’s own best-results number (6.90) after Google spent 25 years earning consumer trust should alarm anyone whose business depends on Google being the only game in town.
The age breakdown is where it gets genuinely interesting. Consumers aged 35 to 54 rated their trust in AI answers at 6.75, essentially even with how the overall sample rates Google. It is not teenagers driving AI search adoption. It is the prime-earning, prime-spending demographic that hires lawyers, books dental work, and researches major purchases. Consumers 55 and older rated AI trust at 4.49, and the 18 to 34 group landed at 5.31.
AI Overviews are not the click apocalypse consumers claim to make them. When Google shows an AI-generated summary at the top of results, consumers rated their likelihood of clicking through to a website anyway at 6.17. Self-reported behavior always flatters the respondent, but this at least suggests the appetite to verify and go deeper has not disappeared. Similarly, when an AI assistant cites linked sources, 40% of consumers say they always or often click through to check them. Only 13% never do.
The Reddit Problem
One more new question this year, prompted by Google’s own increasing use of forum content in results: how likely are you to trust results from Reddit or online forums over a business’s own website?
The overall average was 5.68, slightly above neutral. But age splitting is the real story. Consumers under 55 rated forum trust between 6.5 and 6.8. Consumers 55 and older rated it 4.08.
Read that plainly: every consumer demographic under 55 trusts anonymous strangers on Reddit more than they trust what a business says about itself on its own website. For businesses, this is an uncomfortable but actionable finding. Your website is table stake, but the conversation about you that you do not control now carries more weight with the majority of working-age consumers than the one you do.
What This Means for Digital Marketing in 2026 and Beyond
In 2024, we concluded that Google would remain the clear leader as a search engine choice well into the following year, and it did. We are not writing Google’s obituary in 2026 either. A 6.90 is still a positive score; Google still handles the overwhelming majority of searches, and it remains the primary lead source for our clients across legal, dental, veterinary, and medical. We’ve asked this question before, in Should All Digital Marketing Efforts Focus on Google?, and the answer remains the same: Google is foundational, but it can no longer be the whole strategy.
But the annual thesis of this series has always been that consumer perception leads consumer behavior. Perception has now moved decisively, on every question, in the same direction, at the same time that a genuine alternative reached mainstream adoption. The 2026 playbook cannot be Google-only:
- Google remains the foundation. The majority of consumers still start there, and the fundamentals that win there still apply.
- AI visibility is now a real channel. With 71% of consumers using AI assistants monthly and 9% using them as a primary search tool, how AI models describe and recommend businesses is no longer theoretical. We have been tracking client visibility in AI results for this reason.
- Third-party validation outweighs self-promotion for everyone under 55. Reviews, forum presence, and earned mentions now do work that on-site copy cannot.
- Click-through behavior still rewards being the source. With 40% of AI users checking cited sources, citation is becoming the new ranking.
- The website still closes the deal. Research may start on Google, Reddit, or an AI assistant, but the transaction still happens on your site. Zero-click search does not eliminate the need for a strong, well-presented web presence; it raises the stakes for it.
We will revisit this survey in 2027. Based on five years of watching these numbers, we suspect the 2026 edition will be remembered as the year the gap opened.
Contact the Consumer Trend Specialists at Market My Market
At Market My Market, we communicate consumer trends and prove the viability of campaigns, both paid and organic, through consistent and thorough research and data, not speculation and intuition. Schedule a free consultation by completing our contact form today.
Methodology: Market My Market surveyed 256 US consumers in July 2026 via a paid third-party research panel. The four tracked questions are worded identically to the 2021 through 2024 editions of this survey and answered on a 1 to 10 scale where 5 is neutral. Percentages are rounded. The 2026 sample skewed older than the US census distribution (39% aged 55+); where relevant, this is noted in the analysis.
MMM Author Ryan Klein
The ongoing digital revolution is transforming the way that all businesses interact with clients and customers. Consumers rely heavily on digital channels for researching products and services and expect to make buying choices with the swipe of a finger. For organizations that want to remain competitive, having a defined digital marketing strategy and execution plan is essential for successful outcomes. With a demonstrated history of creating and implementing strategic digital marketing initiatives that drive growth, I am committed to delivering real, measurable results for my clients.