
How to Leverage AI Where It Matters Most in Your Workflow
Are you getting sick of hearing about AI at every business-development-related keynote in existence, or are you more sick of just hearing people talk about
Are you getting sick of hearing about AI at every business-development-related keynote in existence, or are you more sick of just hearing people talk about

KPMG won approval from Arizona’s Supreme Court in February of 2025 to launch a law firm in Arizona, making it the first of the Big

If you’ve been in the marketing world long enough, you’ve likely encountered the “if A works with B, and B works with C, then A

Written by Market My Market’s content team, with contributions from Anastasiya Raynor and Brandi Nicklaus At Market My Market, we believe effective content must do

Written by Market My Market’s content team, with contributions from Tanner Mowery, Kate McLoughin, and Lindsay Bennett-Guido Maintaining a consistent brand voice across multiple dental

With effective SEOs always straddling the line between art and science, technical skills alone will not guarantee success. I’ve seen that the true differentiators really

Written by Market My Market’s content team, with contributions from Katie McLoughlin, Lindsay Bennett-Guido, and Kimberly Osborn At Market My Market, content creation is a

Written by Market My Market’s content team, with contributions from Anastasiya Raynor and Brandi Nicklaus Just as the industrial revolution once transformed the workforce in

In part 1, we laid the groundwork for understanding content efficacy beyond basic traffic metrics. Now, let’s dive deeper into how Google Search Console insights,

In good SEO nature, SEOs are either supporting or contradicting the timeless quote “Content is King.” It goes without saying that content is the foundation

It’s hard to believe we’re already a few months into 2025, and while we don’t have the futuristic augmented reality websites that sci-fi—or Google—promised us,

While every website faces unique challenges, our agency has identified consistent patterns across successful recovery projects. These battle-tested approaches have repeatedly helped sites reclaim lost

Corporate immigration is under pressure. Delays are growing, standards are shifting, and once-routine petitions are now triggering extra scrutiny. For law firms guiding clients through

In the ever-changing digital landscape, law firms must constantly adapt to stay ahead and remain competitive. A crucial aspect of this adaptation lies in mastering

Acquiring clients is becoming more difficult in the changing landscape of legal services. With the advent of do-it-yourself solutions, it’s challenging to compete as an

Are you a law firm aiming to boost your online visibility, attract more clients, and build lasting credibility in 2025? With new tools and features

As we continue exploring how law firms can win in 2025, we highlight some essential strategies and trends. From public relations to innovative uses of

As 2025 approaches, law firms face a uniquely competitive landscape that demands strategic moves and innovative solutions, combining creativity, AI-inclusive initiatives, and data-driven marketing campaigns.

It’s a counterintuitive question coming from an agency founder and current CEO, but should SEO services cost as much as Market My Market has over

The battle between Justia and FindLaw rages every year, but appears to be done as of 2023. Back in 2021, FindLaw was the successor, with

Imagine a world where your law firm’s marketing efforts become more efficient, personalized, and powerful, all thanks to artificial intelligence (AI). The future of legal

In the legal sector, a firm’s reputation is its lifeblood, impacting client trust and the outcome of potential crises. Are you prepared to navigate the

The legal industry is fiercely competitive, and law firms need to stay ahead of the curve when it comes to digital marketing strategies. One powerful

Is print advertising obsolete in the legal industry, or is it evolving to meet the digital age head-on? The future of legal advertising in print

Are you a dentist looking to attract more patients through online advertising? Understanding Google Ads and PPC campaigns for dentists is critical to drawing in

Are you maximizing your dental practice’s growth potential with paid advertising? This article cuts through the clutter to explore efficient paid advertising options designed for

Do you need help to get eyes on your dental blog posts? Discover proven methods for promoting dental blog posts for increased visibility and drive

Are you looking to attract new patients and grow your dental practice through social media? Leveraging social media platforms for dental marketing is beneficial and

When searching for dental services, users are immediately drawn to websites that combine ease of use with comprehensive information. In this guide, we’ll explore the

Retargeting campaigns can be the key to unlocking unutilized dental leads. Are you ready to turn passive website browsers into active dental patients? This guide

A professional website is your solution if you’re a dentist looking to elevate your practice. But where do you start? Creating a professional website for

Navigating HIPAA regulations in digital marketing requires a precise balance of innovation and compliance. If you’re wondering how to promote your healthcare services online without

As a dental professional, understanding the role of social media in dental marketing is no longer optional—it’s a necessity. From enhancing patient relationships to increasing

The dental industry is evolving rapidly, and one of the most significant advancements in recent years has been the integration of recording and analyzing data

A well-designed dental website serves as a digital front door to your practice, playing a crucial role in attracting new patients and providing them with

Exploring video marketing opportunities on YouTube is crucial for modern brands seeking to expand their online presence. This concise guide provides practical steps for engaging

The legal industry is undergoing a significant transformation, and Rob Scott, co-founder of Manjer, is at the forefront of this shift. On the latest episode

Finding the right employees for a law firm has long been a challenge for many managing partners and firm owners. In a recent episode of

In a crowded digital landscape, crafting impactful messaging is essential for businesses to stand out. For law firms, this means creating content that resonates with

The Legal Mastermind Podcast recently explored strategies to help law firms stay ahead in the increasingly competitive legal marketing landscape. This episode dives into actionable

In the ever-evolving legal landscape, staying ahead requires constant innovation and a willingness to adopt new strategies. The Legal Mastermind Podcast consistently delivers actionable insights

In this episode of the Legal Mastermind Podcast, Eric Bersano from Market My Market engages in an insightful conversation with Ken Wahlster, founder and CEO

In a recent episode of the Legal Mastermind Podcast, Thomas Dunlap, managing partner at Dunlap Bennett & Ludwig, shared his journey of building a successful
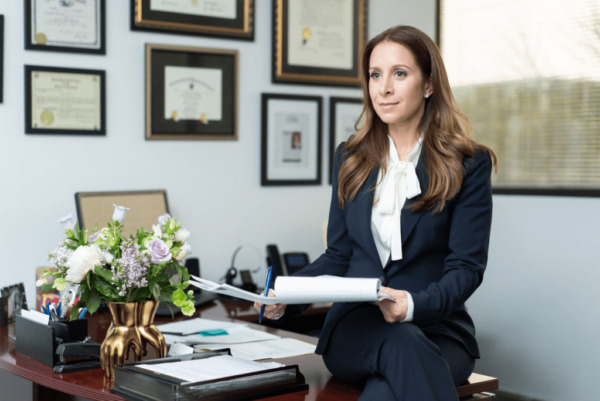
The Legal Mastermind Podcast, presented by Market My Market, recently featured Michelle Ross, founder of M. Ross & Associates, LLC, a business law firm in

In a recent episode of the Legal Mastermind Podcast, legal sector analyst and consultant Jordan Furlong shared his expertise on the evolution of the legal

The latest episode of the Legal Mastermind Podcast featured an enlightening discussion with Melanie Herschorn, an expert in book publishing and marketing. Hosted by Ryan

In a recent episode of the Legal Mastermind Podcast, host Eric Bersano sat down with Haley Revel, the Managing Director of HR and Talent Management

The legal technology sector has seen massive shifts over the past decade, driven largely by artificial intelligence (AI) advancements. What was once a fringe topic
Molly McGrath is the Founder of Hiring and Empowering Solutions, LLC. Molly has coached, consulted and directed presidents and founders of national organizations and over 5,000

Robert Scott is the Co-Founder of Monjur. As a co-founder of Monjur, a cloud-based, AI powered legal solution providing contracts-as-service solutions for the IT industry,

How Law Firms Will Win in 2025 Part 2 — Legal Mastermind Podcast hosts Eric Bersano and Ryan Klein discuss the viewpoints and goals that your
How Law Firms Will Win in 2025 Part 1 — Legal Mastermind Podcast host Ryan Klein discuss the viewpoints and goals that your law

Kyle Hebenstreit is the CEO of PMP (PracticeMadePerfect). For more than 15 years, PMP has partnered with consumer law firms to help them reach more clients through

Jeff Hampton is the Owner of YouTube Rainmakers and the Founder of Fulgham Hampton Criminal Defense Attorneys and STR Law Guys. Jeff is a seasoned entrepreneur

David Matthews is the Firm Founder of Matthews and Associates. David has been chosen through US News & World Report as one of the Best Lawyers

Mary Blackiston is a Conversion Copywriter and Google Ads Conversion Strategist. Mary helps law firms and service-providers bring in more qualified leads and clients. With tailored

Mike Mellor is President and Founder of 742Advisors. With over 20 years of experience in marketing and business development for professional services firms, Mike recently launched

RJon Robins is the Co-Founder of How To Manage A Small Law Firm. RJon Robins is an 8-figure entrepreneur, licensed attorney, and bestselling author. He founded

David Klein is the Director of Business Development for ConsulTV. David began his advertising journey running his own business doing print advertising and Google Adwords. Comparatively,
Alay Yajnik is the Founding Partner of Law Firm Success Group, Host of the Lawyer Business Advantage Podcast, and author of Staffing Up: The Attorney’s Guide to
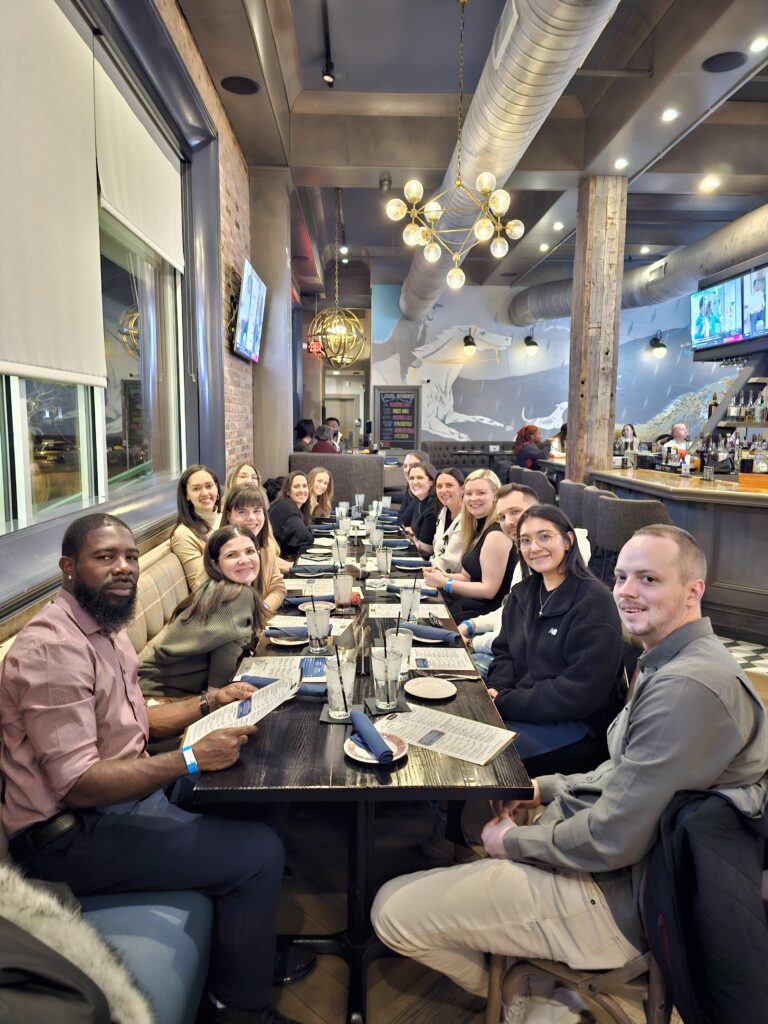
Market My Market recently hosted an SEO retreat at our newly established Charlotte, NC office, bringing together team members from across the country—and even internationally—for
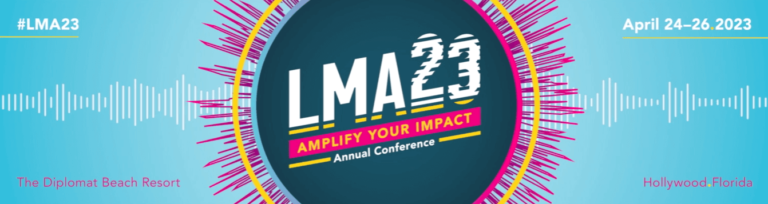
The Legal Marketing Association will host their annual conference this April at the Diplomat Resort in Hollywood, Florida. We’re eager to attend the conference and
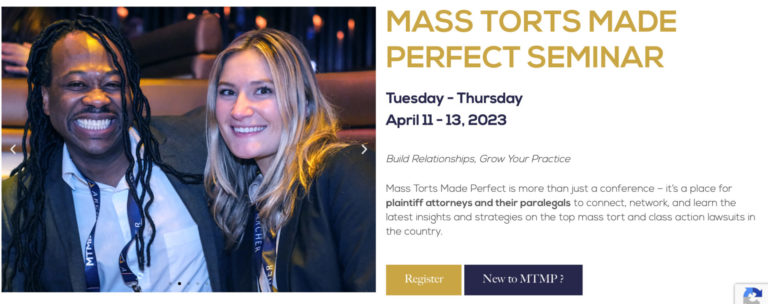
This April, the Mass Torts Made Perfect Conference will be held at the Wynn Hotel in Las Vegas, NV. MTMP is an event that Market
This October, we attended the Mass Torts Made Perfect Conference at the Bellagio Hotel in Las Vegas, NV. The seminars and events we attended throughout

This years AAJ Winter Conference will be held at the JW Marriott in Palm Desert. We’re excited to see some current clients in person and